The on-premise continues to ebb and flow as we close in on the end of summer. Draft volumes, tap counts and rate-of-sale are evolving as we all adjust to the new landscape for bars and restaurants.
In this report, we take a look at the weekend of August 28-30 and compare that to our reviews of August 14-16 and July 31-August 2.
This review of insights and retail performance is part of an on-going series which tracks the reopening of America’s bars and restaurants.
Cheers!
On-Premise Status Report (August 28-30)
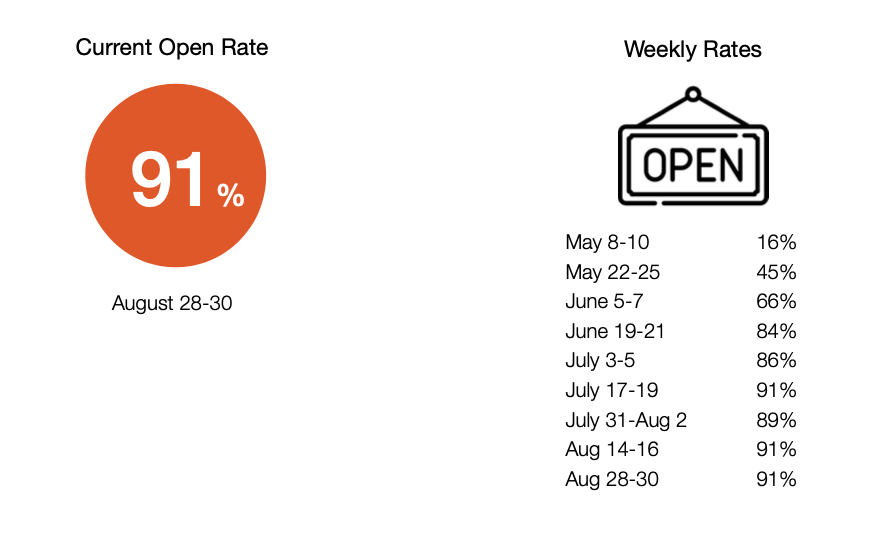
The Open Rate (locations open and pouring beer) held steady at 91%, this for the second consecutive period and third-of-four.
The next few weeks will be interesting to track, as more states are opening indoor dining, coupled with the start of the football season and fall weather quickly approaching.
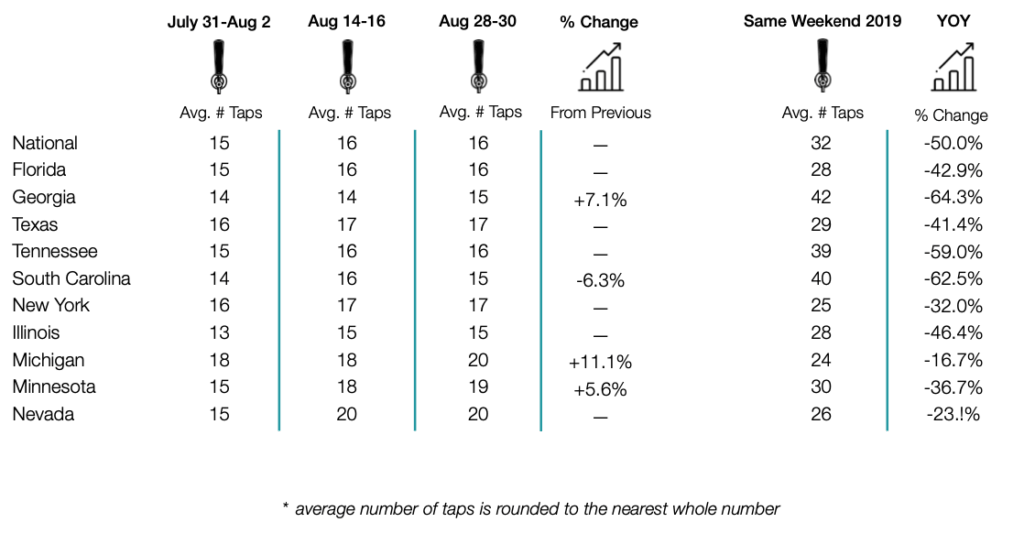
Average Number of Taps held firm at 16 per location nationally, mirrored by six of the 10 states tracked in this report. Michigan added two taps per location, climbing to 20 per, while Georgia and Minnesota each added one tap per location. Over the past two periods, Minnesota has climbed from 15 taps per location to its most recent count of 19 per.
* average numbers of taps is rounded to the nearest whole number
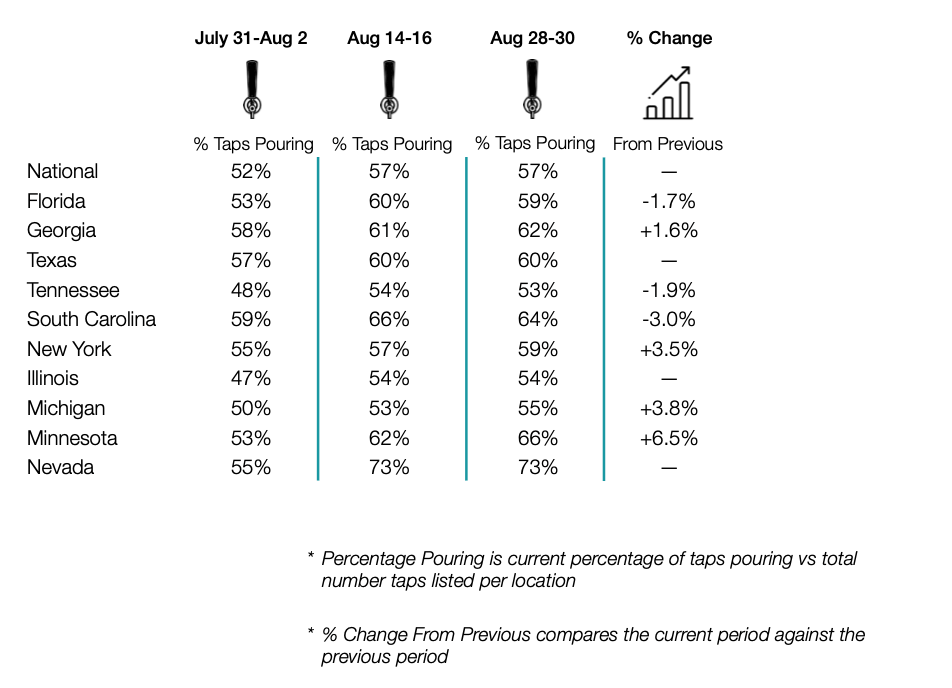
Similarly to the Open Rate and Average Number of Taps, the Percentage of Taps Pouring was flat nationally for the period. Most states tracked were relatively flat, as well, seeing anything from a 1.9% loss (Tennessee) to a 3.8% gain (Michigan). Mirroring its growth in Average Taps, Minnesota saw the largest bump in Percentage Pouring at +6.5%.
* % Change From Previous compares the current period against the previous period
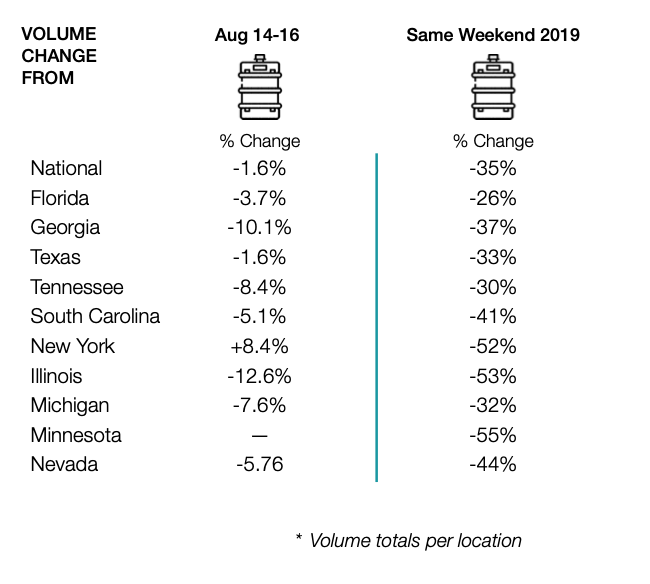
On-premise volume (per location) saw a slight dip from August 14-16, down -1.6%. New York was up a healthy +8.4%, while Illinois and Georgia were both down double-digits, falling -12.6% and -10.1%, respectively.
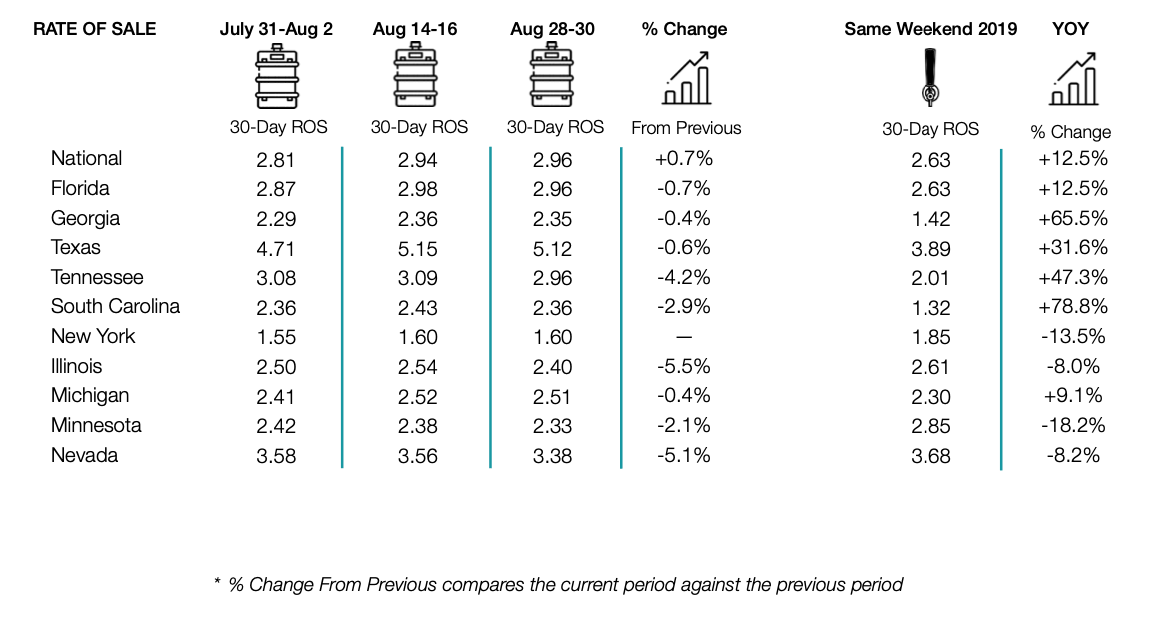
Rate of Sale was flat Nationally, and fell in nine of 10 states tracked in the period. Illinois (-5.5%) and Nevada (-5.1%) saw the largest drops, respectively.
* % Change From Previous compares the current period against the previous period
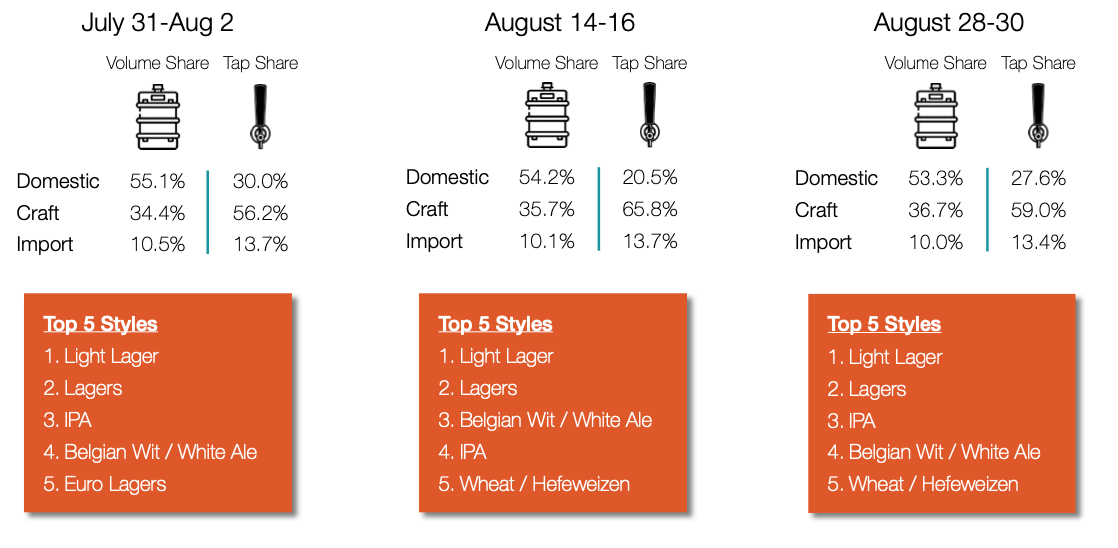
Craft continues to siphon a little volume share each period, this time climbing to 36.7%, up from 35.7% (August 18-20) and 34.4% a month back (July 31-Aug 2). Domestic checked in at 53.3%, down from 54.2%, while Imports remained flat at 10.0%. Craft taps fell to 59.0%, down from a high of 65.8% two weeks ago. Domestic picked up the variance, climbing back to 27.6%.
The Top 5 Styles held firm for the second consecutive period. The battle for #3 between IPA and Belgian Wit / White Ale seems to be over, for the time being at least. The gap between the two continues to widen as IPA has firmly re-established itself as the #3 style.
BeerBoard is a technology company enabling the food & beverage industry to make data-driven decisions about its bar business. It manages over $1 billion in retail draft beer sales and 45,000 products through its industry-leading solution. The company’s patented digital platform captures, analyzes, and reports real-time data related to bar performance, brand insights and inventory. Built for retailers, brewers and distributors, the versatile technology is easily operated from a single dashboard, and it has streamlined operations and increased top and bottom line revenue all over the United States.
Thirsty For More?
Want to see where BeerBoard’s data and insights can take you and your operation? Contact us at retailsales@beerboard.com or 888.298.3641.
We always love talking beer!
New Technology to Drive Your Business
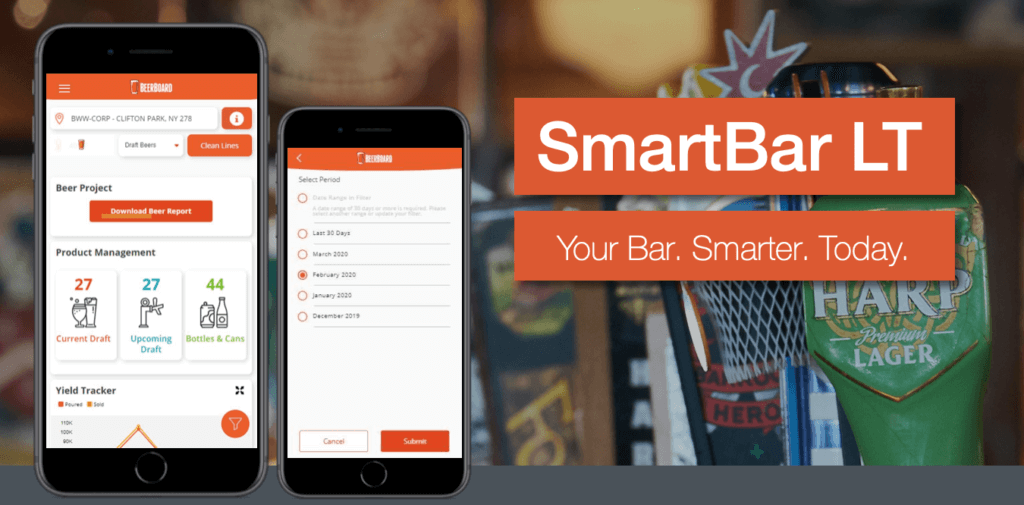
Your Bar. Smarter.
We designed SmartBar LT to be fast and flexible. It has all the power of BeerBoard’s industry-leading technology, the same user-friendly platform, but no hardware to install.
Be up and running in as little as two weeks.
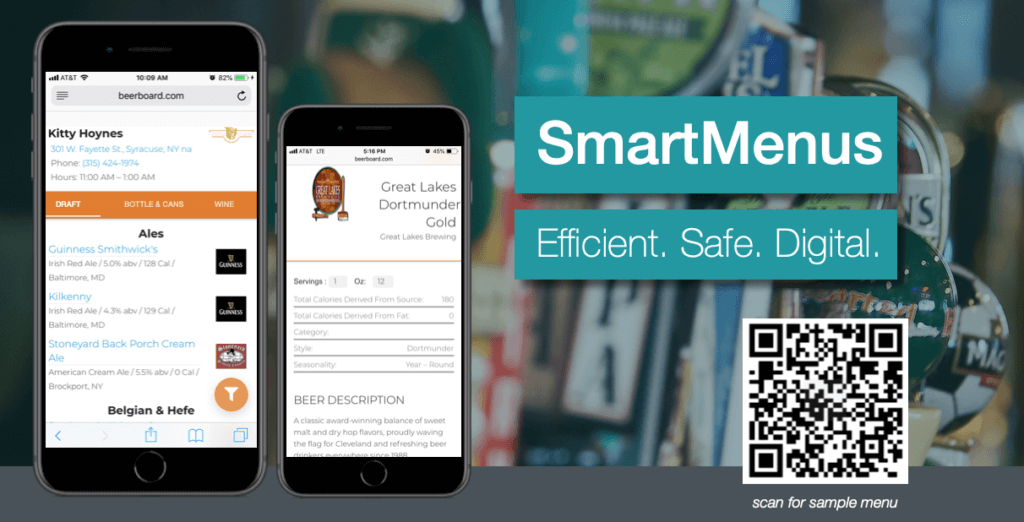
Efficient. Safe. Digital .
How we interact with customers has changed, but that doesn’t mean it has to be difficult. We developed SmartMenus so you can provide your full bar menu in an efficient, safe, digital format.
Get a FREE trail today!